Analysis symbology
After running an analysis, Siter displays QD arcs, dimensions, and violation indicators on the map. Use the Analysis Symbols sidebar to toggle each symbol type on or off and to customize the line, fill, and label styling for any criteria type code (IBD, PTRD, IMD, etc.).
Prerequisites
- You must have run an analysis on the project (see Running an analysis)
How to open the Analysis Symbols sidebar
-
Click the menu icon on the left sidebar header to open the sidebar chooser
-
Select Analysis Symbols
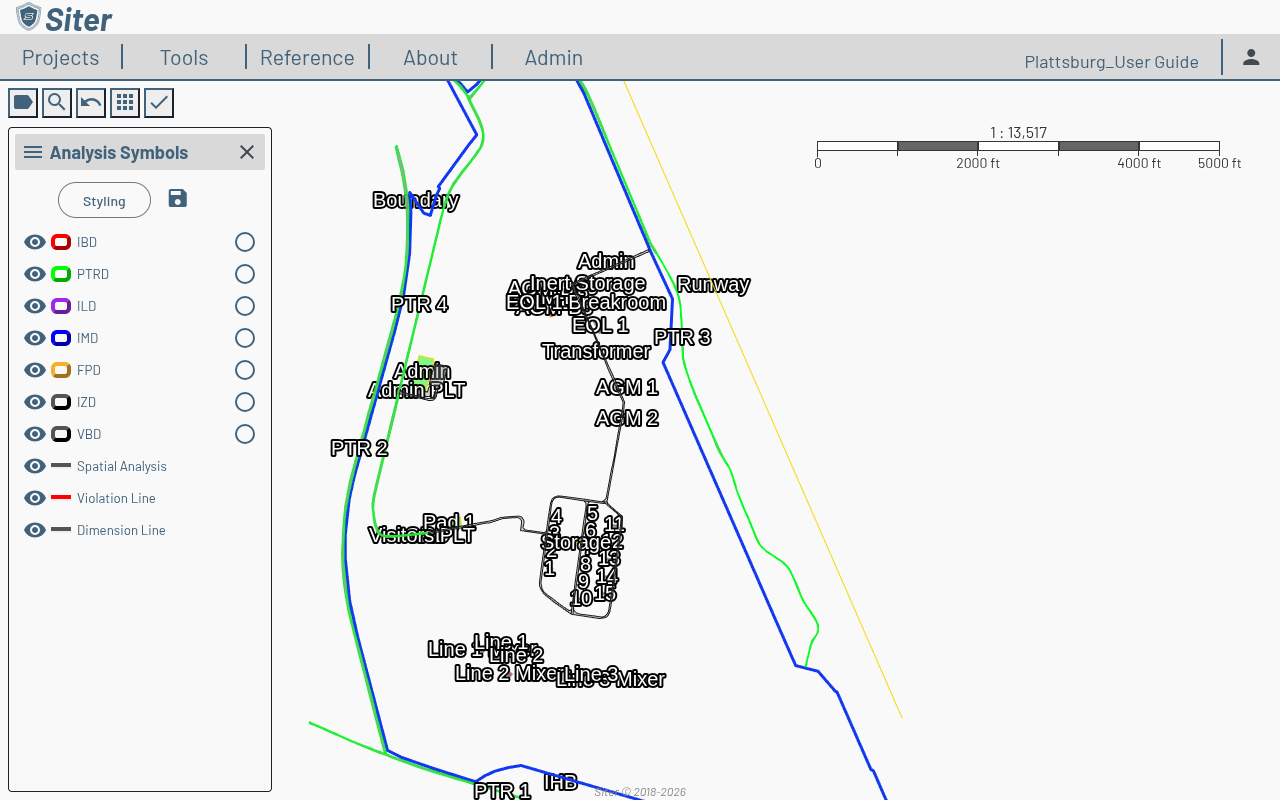
The sidebar lists every criteria type code present in the analysis results, plus rows for Spatial Analysis, Violation Line, and Dimension Line. Each row has:
- An eye toggle to show or hide that symbol on the map
- A color swatch and line preview that doubles as a quick edit
- A radio selector for picking the row whose styling you want to edit
How to toggle a symbol on or off
- Open the Analysis Symbols sidebar
- Click the eye icon next to the symbol row
- The symbol shows or hides on the map immediately — no save required
How to customize a symbol's styling
- Select the symbol row by clicking its radio button
- Click Styling in the sidebar header
- Adjust the editor fields — line color and thickness, fill color and opacity, dash pattern, label font, label color
- Click the save (floppy) icon in the sidebar header to persist changes
The styling editor is parameterized — the available fields depend on the symbol type. Arc symbols expose line and fill controls; dimension lines expose label text and font controls; violation lines expose color and stroke controls.
How to reset to defaults
- Open the project dashboard
- Click the settings gear and select Default Symbology, or
- Use the Default Symbology button surfaced at the project level when overrides exist
Resetting clears all overrides and restores Siter's built-in palette for every symbol type.
Related topics
- Running an analysis — executing and viewing analysis results
- Drawings — exporting the styled map view to a drawing output