Placement analysis
Placement analysis lets you evaluate a candidate facility location without adding it to the project. Pick a spot on the map, give the candidate explosives and attributes, run a what-if analysis, and view the resulting arcs side-by-side with the project's regular analysis — all without committing a real feature. Use it to test relocations, evaluate new construction siting, or compare two candidate placements before deciding.
Added in v0.21.
Prerequisites
- Your project must have a baseline analysis run (see Running an analysis)
- You must have the Project Edit Permission or higher
How to open the Placement Analyses sidebar
-
Click the menu icon in the left sidebar header
-
Select Placement Analyses
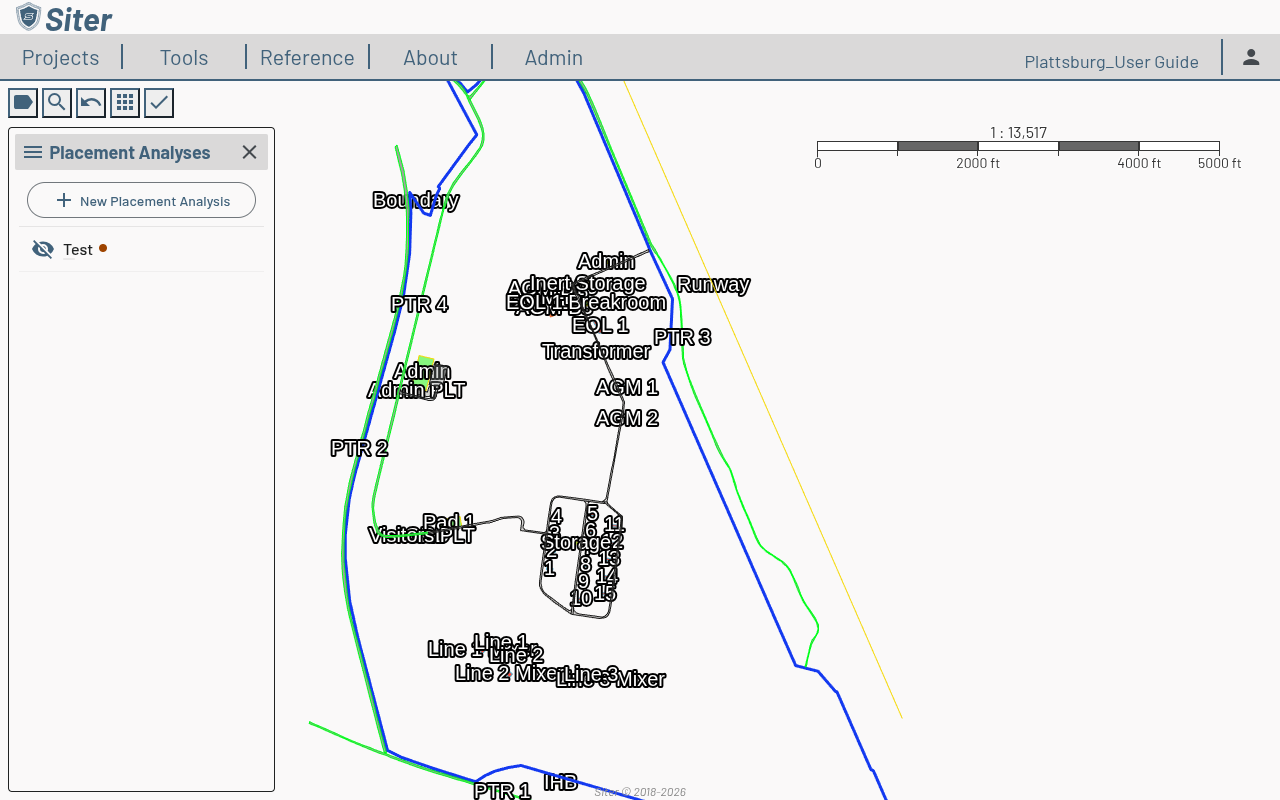
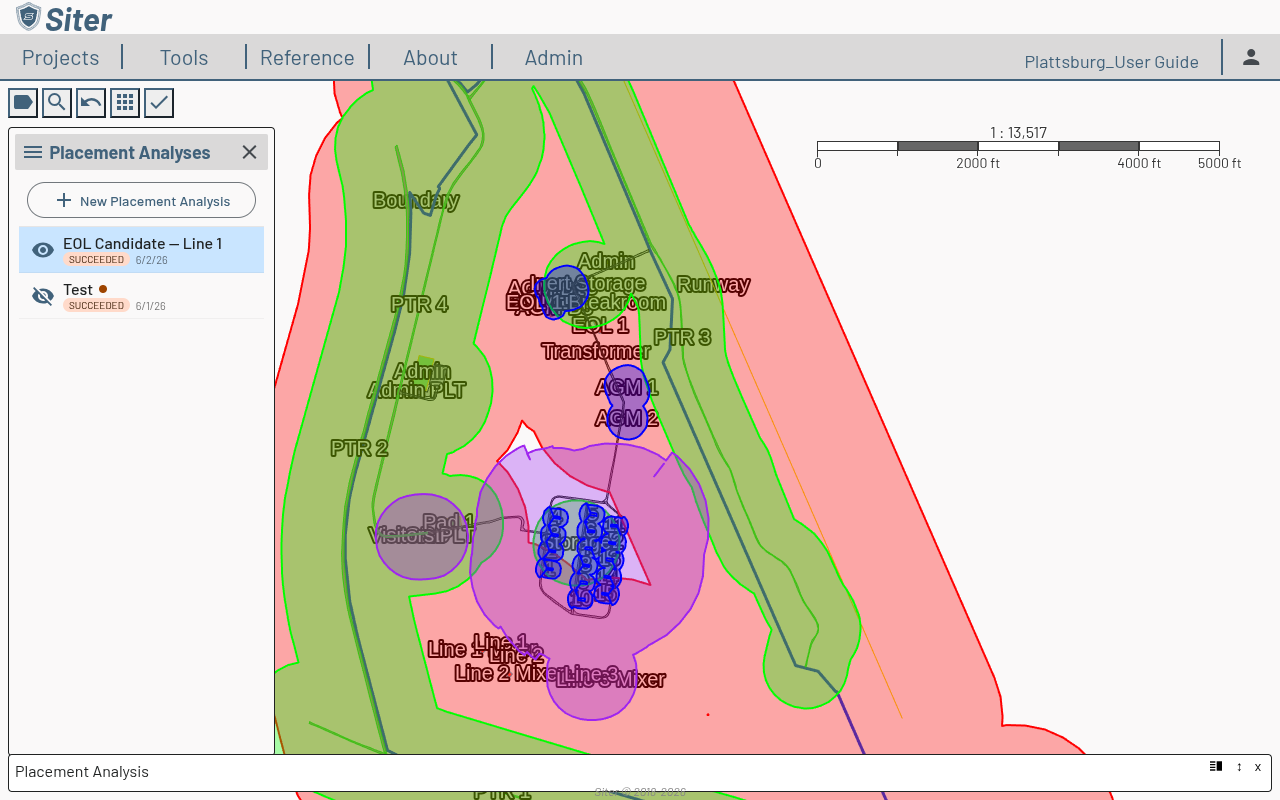
Each saved placement analysis appears as a row with an eye toggle for map visibility. A small orange dot indicates the underlying project data has changed since the placement was last run — re-run to refresh.
How to create a new placement analysis
- Open the Placement Analyses sidebar
- Click New Placement Analysis
- Give the placement a Name (optionally copy arc symbols from an existing placement) and click Create. The new placement is selected and its results footbar opens at the bottom of the screen
- Position the candidate on the map and give it the shape the real facility would have
How to configure the placement feature
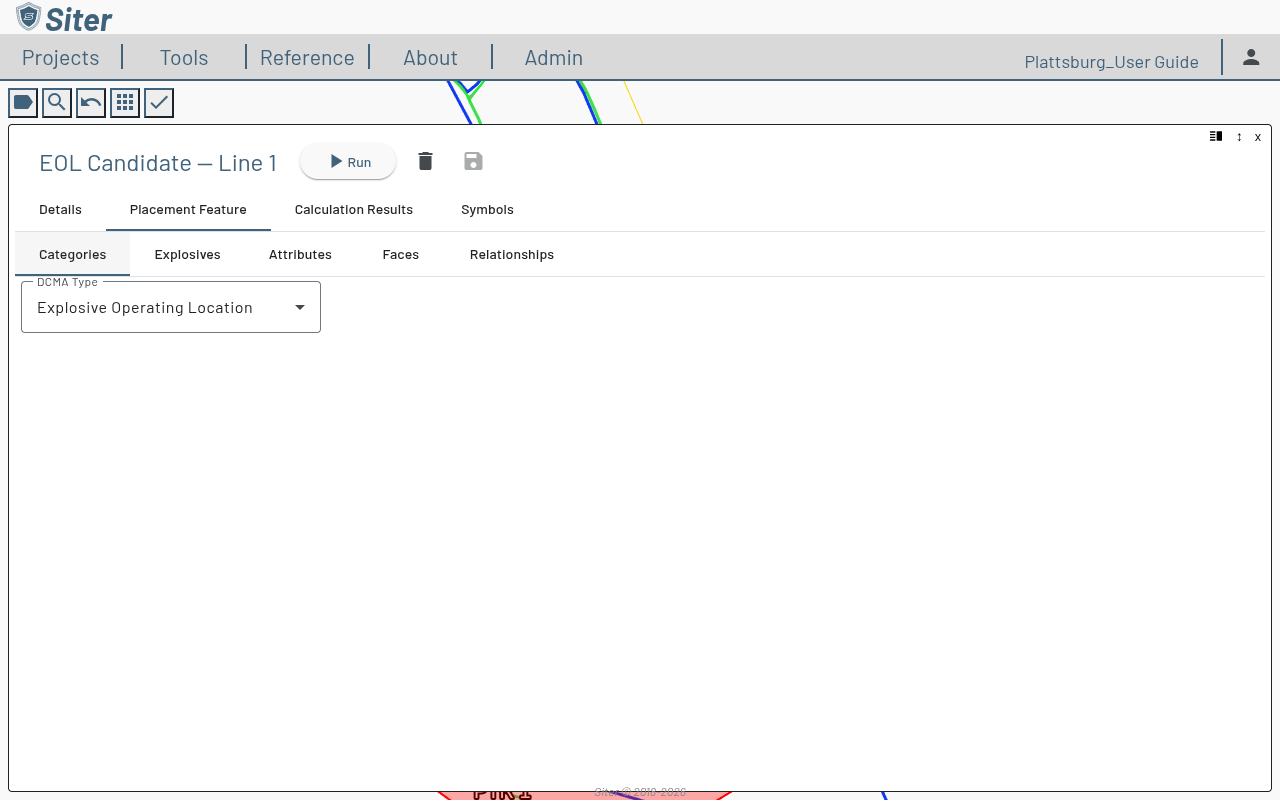
The candidate is described on the Placement Feature tab of the results footbar, which has its own sub-tabs. The example below builds an Explosive Operating Location assigned to operating line 1.
-
On the Categories sub-tab, choose the facility type per criteria — here, Explosive Operating Location
-
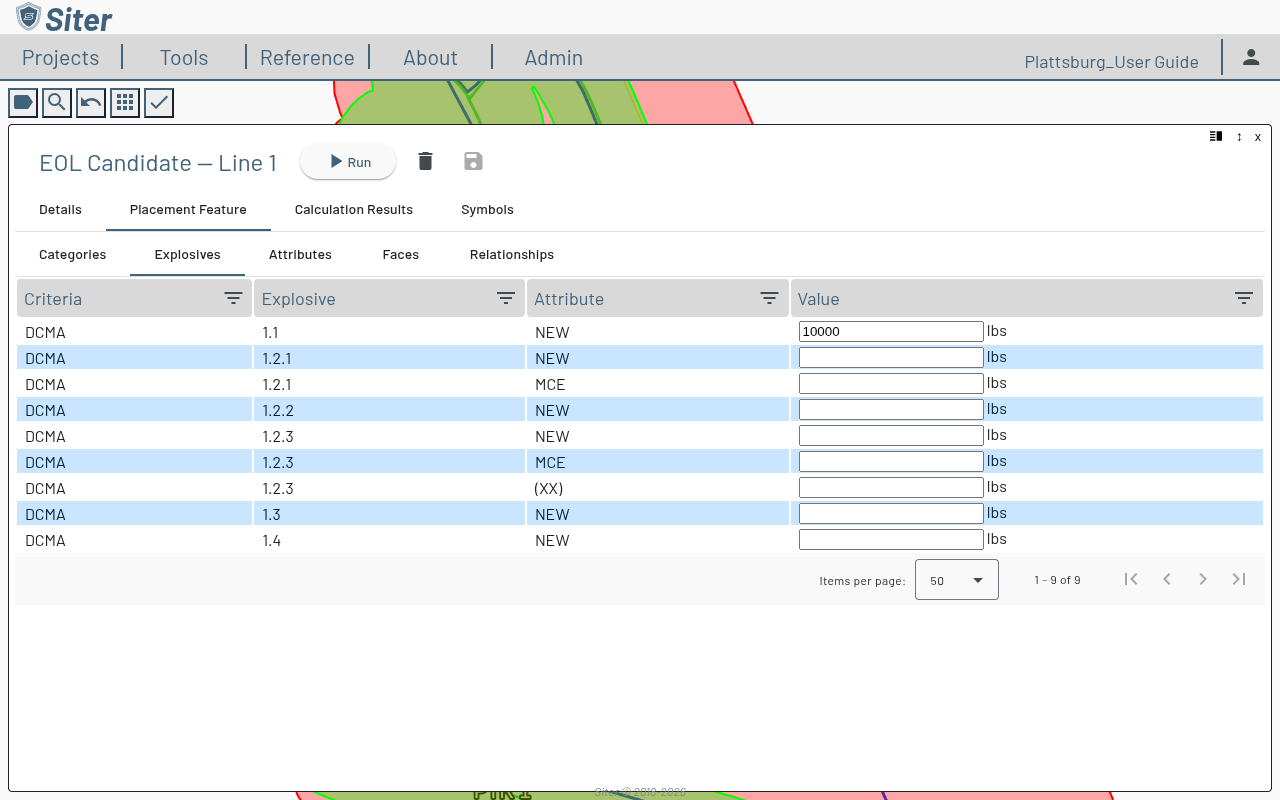
On the Explosives sub-tab, enter the candidate's NEW by hazard division — here, 10,000 lbs of 1.1. The NEW drives the size of the resulting arcs
-
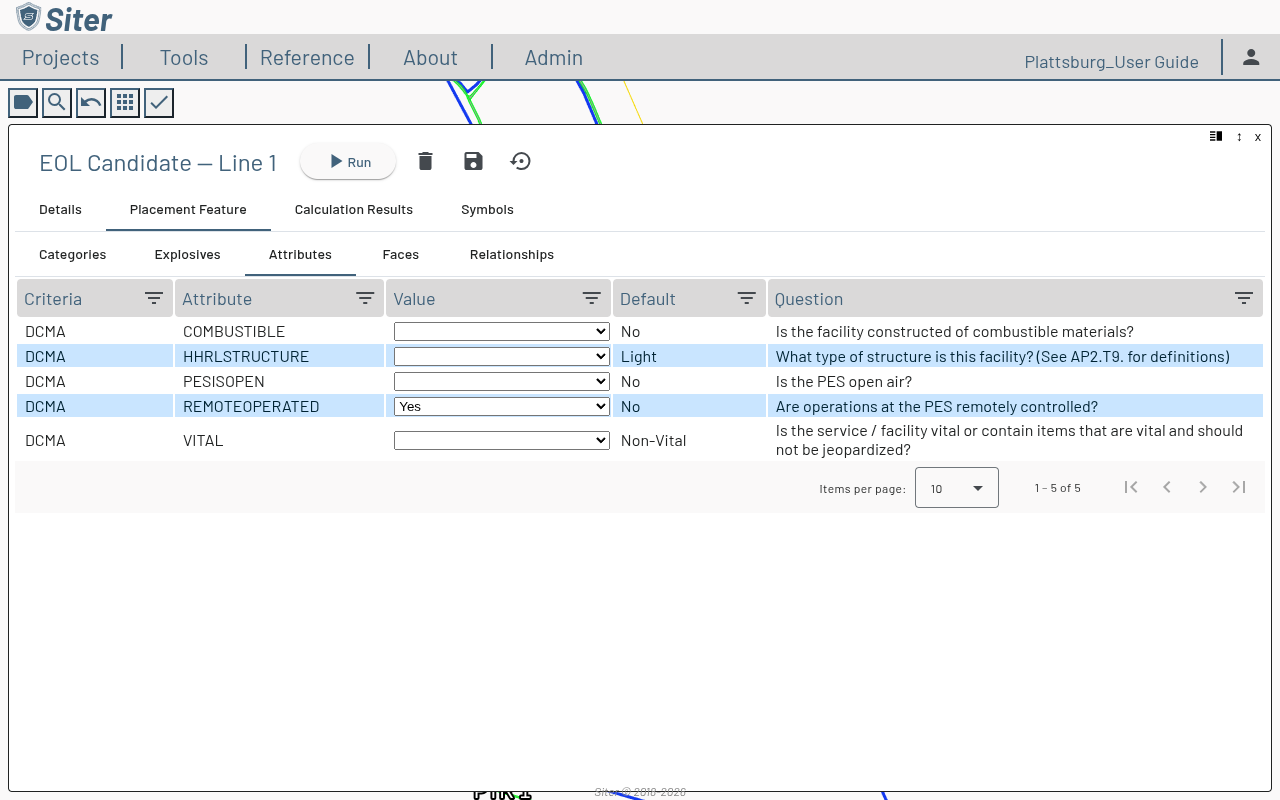
On the Attributes sub-tab, set any criteria-specific attributes. Each row shows the attribute's default; change the Value to override it. Here, REMOTEOPERATED ("Are operations at the PES remotely controlled?") is set to Yes
-
On the Faces sub-tab, review the candidate's analysis faces (these follow the type code's segmentation rule)
-
On the Relationships sub-tab, give the candidate its relationships. Click the exposure (Add/Remove Related Facilities & Relationship Groups) button to open the relationship selector, then apply a relationship group — here, Line 1 — so the candidate inherits that operating line's relationships. Click OK
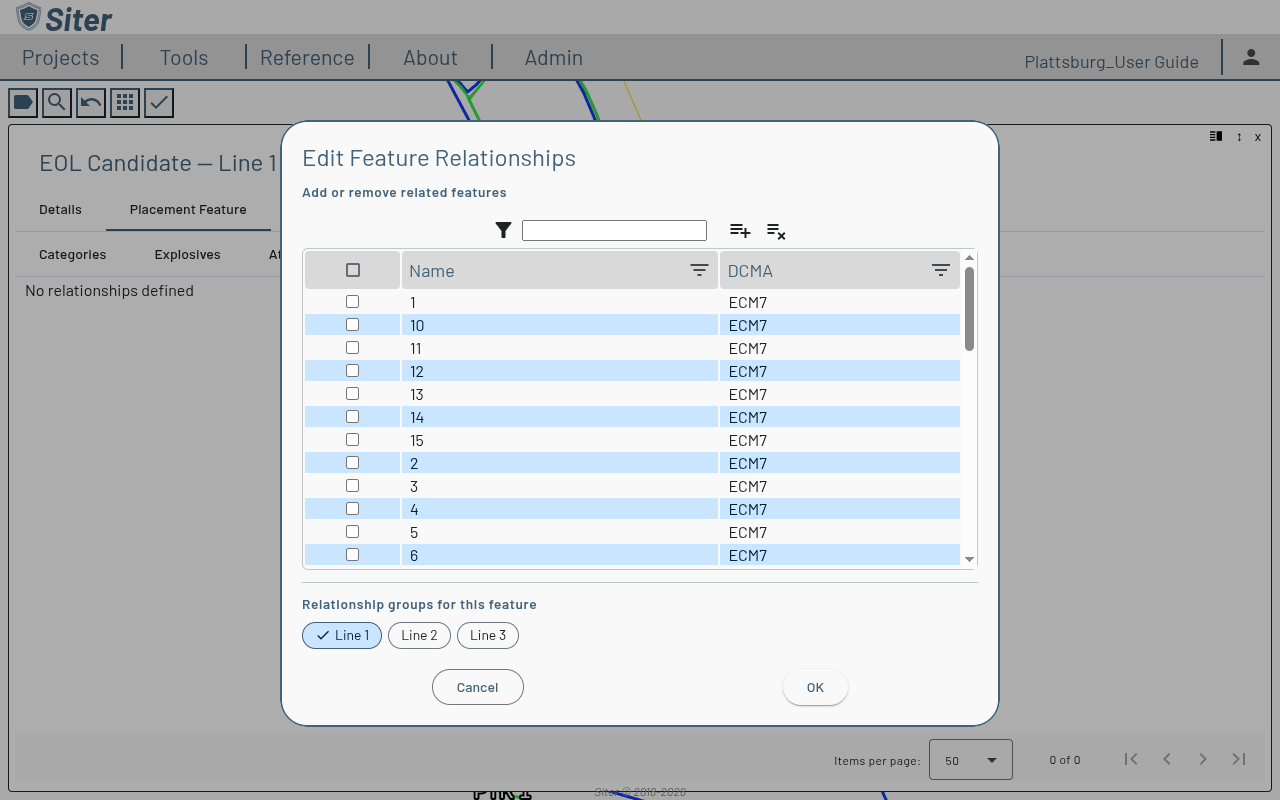
The toolbar then shows Groups: Line 1. Use the build button to resolve the group's relationships from the project's operating-line matrix; this only affects this placement feature.
-
Click the save icon to persist the placement feature
How to run and view results
- Click Run at the top of the results footbar. The status chip moves through Queued → Running → Succeeded, and the Details tab shows a progress bar
- The footbar has four tabs:
- Details — name, run status and timestamps, and the stale-data banner
- Placement Feature — the Categories / Explosives / Attributes / Faces / Relationships configuration above
- Calculation Results — required and actual distances for the candidate, with a Show filter (Governing, Required, All, Selected, or Dimensioned distances), search, and CSV export
- Symbols — a parameterized symbol editor for this placement's arcs only
When the run finishes, the candidate's buffer arcs draw on the map. With 10,000 lbs of 1.1, the example EOL projects a full set of graduated arcs — the broad inhabited-building-distance buffer reaching the surrounding facilities, with the tighter inner distances (intermagazine and intraline) closer to the candidate. Related facilities (those sharing the candidate's operating line) and unrelated exposed sites are buffered differently, which is what makes the result descriptive of a real placement:
How to render multiple placements simultaneously
Each placement analysis has its own StyleSet, so you can toggle several placements on the map at once for visual A/B comparison. Click the eye icon next to each placement in the sidebar to show or hide its arcs.
Stale data indicator
If the project's features or operating lines change after a placement analysis runs, the placement is flagged as stale. The sidebar row shows an orange dot; the footbar shows a banner. Re-run the placement to refresh.
Related topics
- Running an analysis — baseline project analysis
- Analysis symbology — styling shared with placement arcs
- Feature relationships — relationship groups that drive placement relationships