Map view
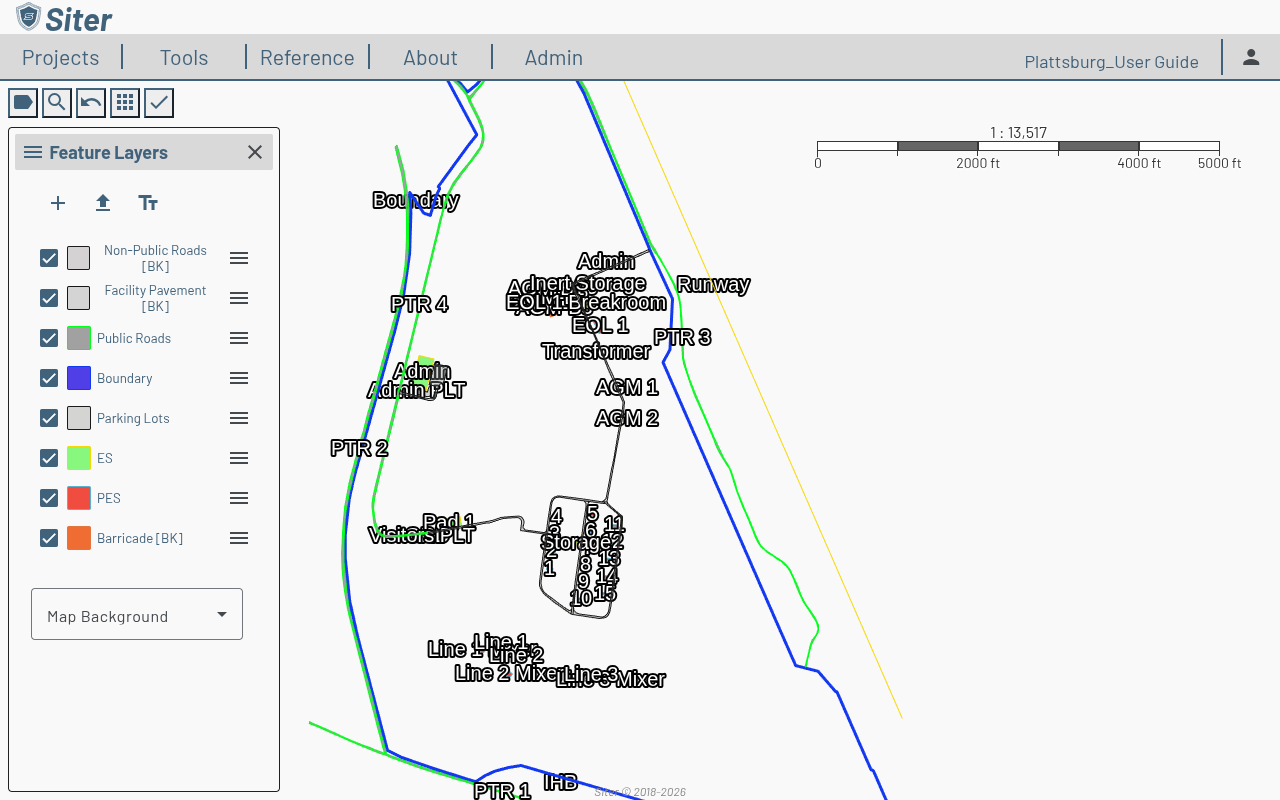
The Map View is the primary workspace in Siter. When you open a project, the map displays your site with all its layers and features. Use the map to navigate your project area, add and select features, and access analysis tools.
Prerequisites
- You must have an open project (see Projects)
How to navigate the map
The map supports standard navigation controls:
- Pan — click and drag to move around the map
- Zoom in/out — use the scroll wheel or pinch gesture
- Scale bar — the current scale is displayed in the upper-right corner of the map (e.g., 1:136,226)
The map workspace
When a project is open, the workspace is organized into three panels. You won't always see all of them at once — each appears when it has something to show.
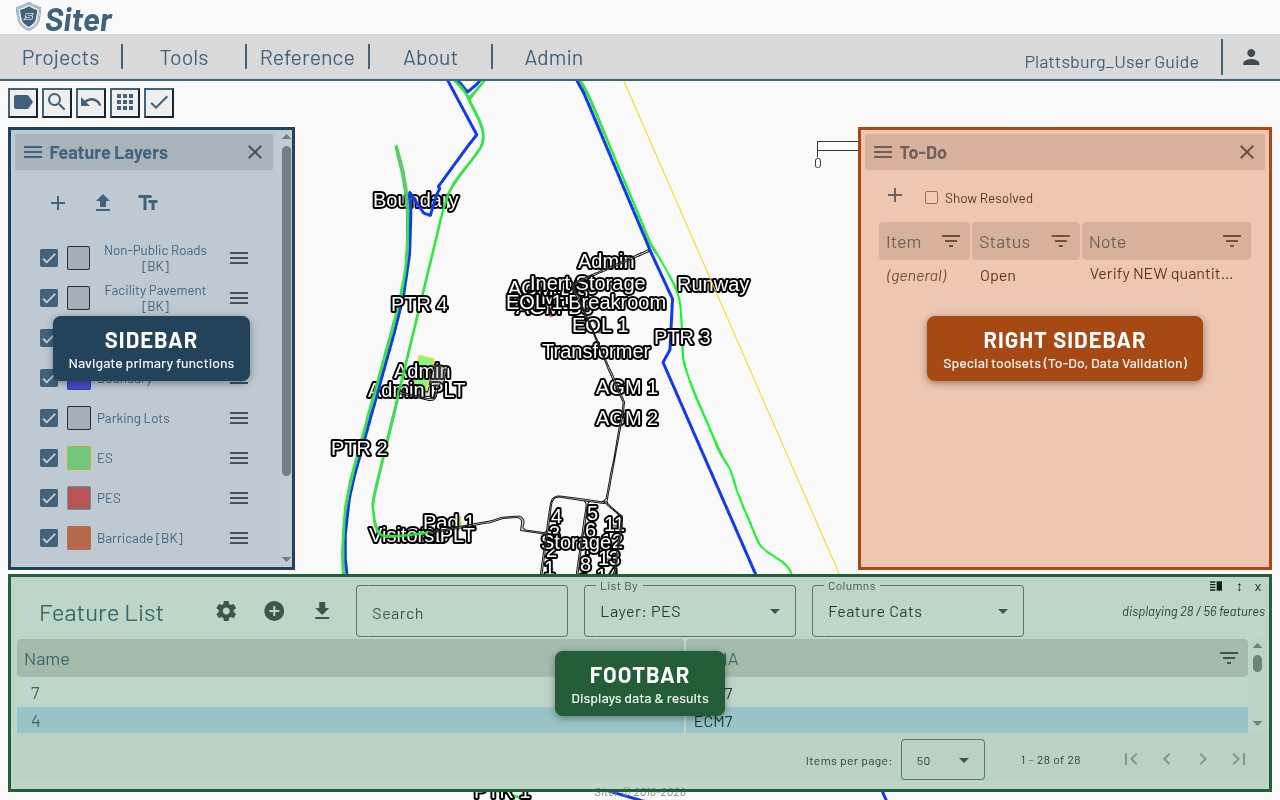
- Sidebar (left) — your primary navigation. Switch between Feature Layers, Analysis Symbols, Result Sets, Placement Analyses, Markup, and the Digitizer (detailed in Sidebar overview below). It opens by default when a project loads.
- Footbar (bottom) — where data is displayed: the Feature List and feature dashboards, analysis results, and task-specific panels such as Add Feature, Bulk Edit, the project dashboard, and placement-analysis results. It opens when you select something with data to show, and you can snap it to a preset height (Min / Default / Medium / Max) or close it from the controls in its top-right corner.
- Right Sidebar (right) — special toolsets that sit apart from the main navigation: the To-Do list and Data Validation (the explosive scrubber). Open it from the Workspace menu (the toolbar's label button); its header has a chooser to switch between the two tools.
Any of these panels can also be resized by dragging the edge where it meets the map — drag the Footbar's top edge, or a sidebar's inner edge, to set a custom size.
Toolbar overview
The toolbar at the top of the map provides quick access to common actions:
| Icon | Name | Description |
|---|---|---|
| Workspace menu | Open panels and toggle sidebars (Map Features, Analysis Results, Placement Analyses, Data Validation, To-Do's, Show/Hide Sidebar) | |
| Identify | Click a feature on the map to view its details | |
| Undo / Redo | Open the edit history to undo or redo recent changes (shows "There are no commands to undo or redo" when empty) | |
| 9-dot menu | New Feature, New Layer, Import, Bulk Edit, Relationship Group Editor | |
| Analysis | Run analysis, view results, and manage analysis state. The icon reflects status — when analysis is needed (features changed since the last run), when results are current, or a done / total count while a run is in progress |
Workspace menu
Despite its label icon, the first toolbar button opens the Workspace menu for opening panels and toggling sidebars:
- Map Features — show or hide the Feature List footbar
- Analysis Results — open the Analysis Results footbar
- Placement Analyses — open the Placement Analyses sidebar
- Data Validation — open the explosive-scrubber panel on the right
- To-Do's — open the To-Do list panel on the right
- Show/Hide Sidebar and Show/Hide Right Sidebar — collapse or restore each sidebar
9-dot menu
Click the 9-dot menu to access:
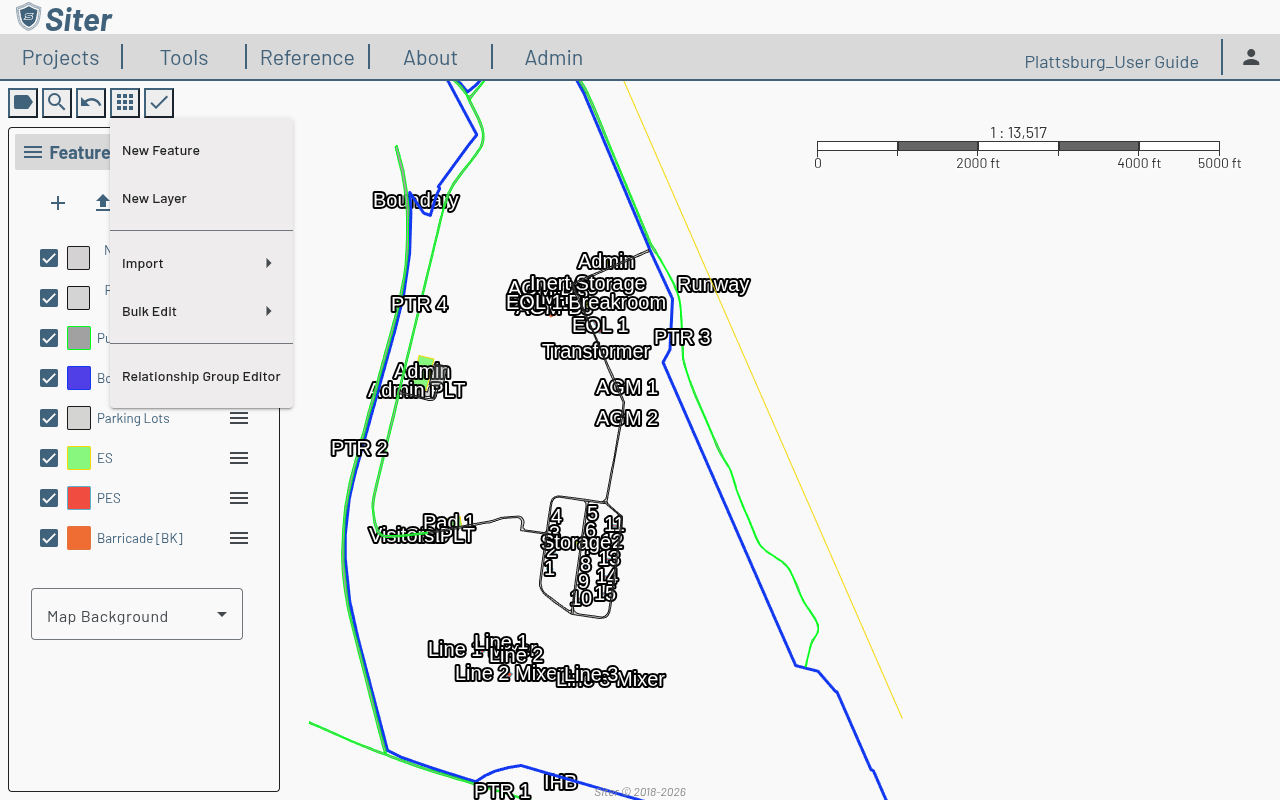
- New Feature — add a new feature to the map
- New Layer — create a new layer
- Import — import data from external files
- Bulk Edit — batch-edit multiple features at once (see Bulk editing)
- Relationship Group Editor — author relationship groups and their Group × Group × Criteria matrix (see Relationship Groups)
Analysis menu
Click the Analysis button to access:
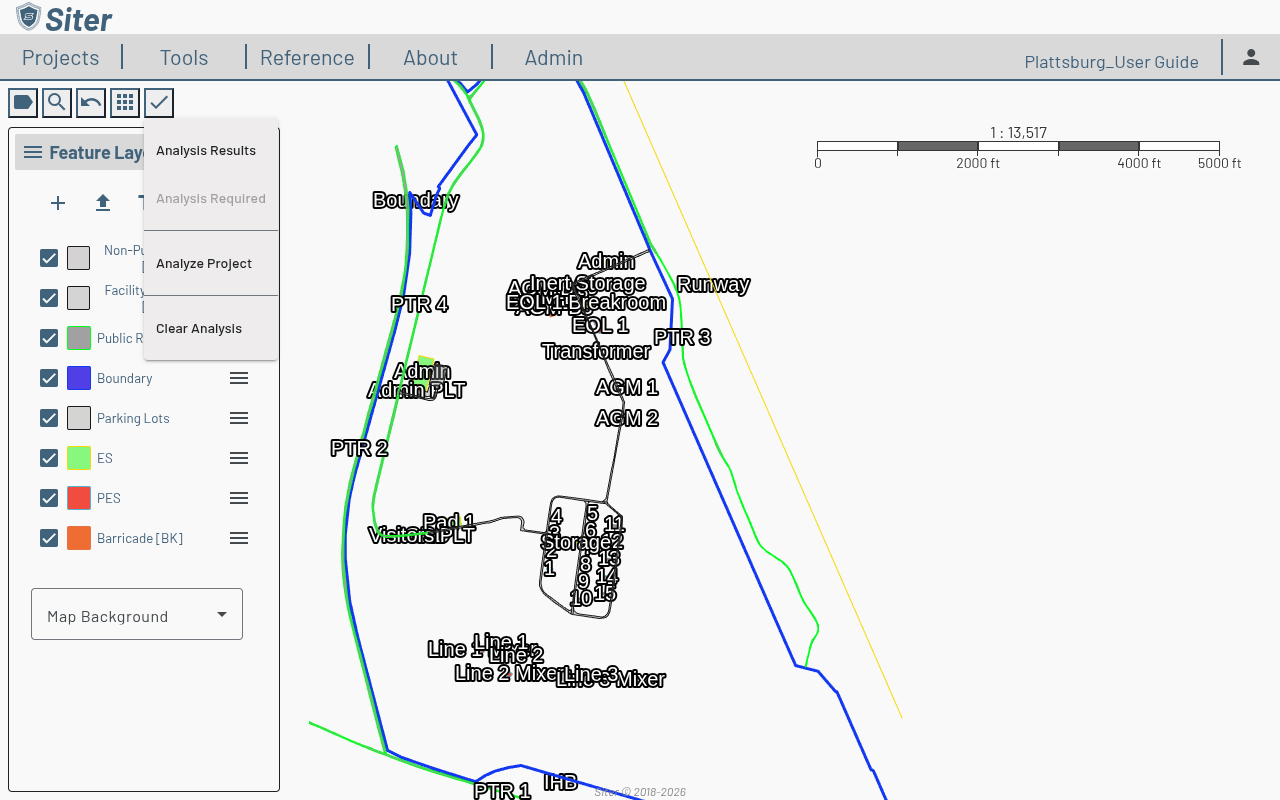
- Analysis Results — open the Analysis Results footbar with Calculations, Spatial Analysis, and Errors tabs
- Analysis Required — becomes active when features have changed since the last analysis; lists the features that need attention
- Analyze Project — run a full QD analysis on every feature
- Clear Analysis — remove all analysis results
Analysis Required can be used to narrow down facilities that are failing to analyze. If immediately after running an analysis, you don't get a check mark, there's an analysis error.
Sidebar overview
The left sidebar exposes multiple modes — click the menu icon in its header to switch between:
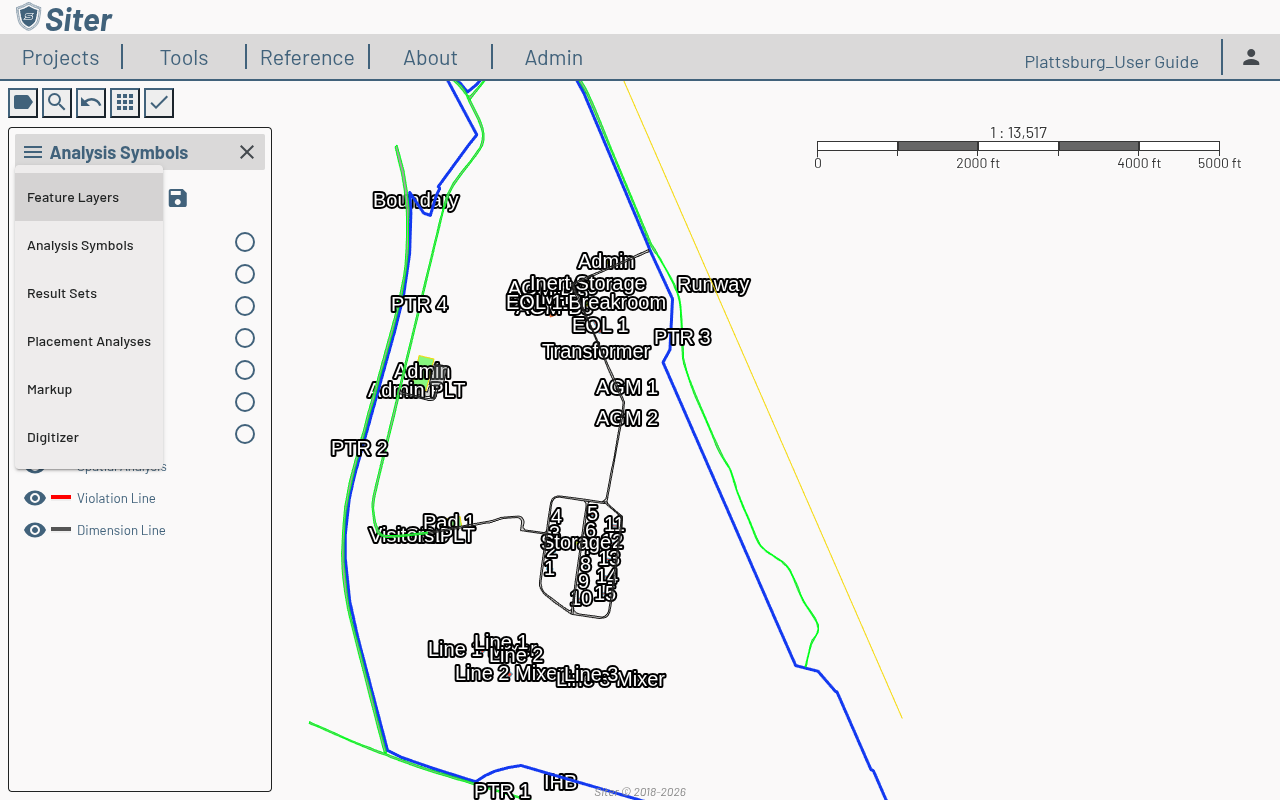
- Feature Layers — default mode, lists layers and their associated information
- Analysis Symbols — toggle and style each criteria's result arcs on the map (see Analysis symbology)
- Result Sets — saved snapshots of analyses (see Drawings)
- Placement Analyses — what-if analyses for candidate facility placements
- Markup — distance, area, and buffer measurements (see Measurements)
- Digitizer — snapping and angle/length constraints for precise feature geometry (see Digitizer)
The To-Do and Data Validation tools live in the Right Sidebar rather than this sidebar — see The map workspace above.
How to identify a feature
- Click the (identify) button in the toolbar to enter identify mode
- Click a feature on the map
- The feature dashboard opens, showing the feature's details, attributes, and other information
Project name and dashboard
The project name is displayed in the upper-right corner of the toolbar. Click it to open the project dashboard, which provides access to project details, criteria, users, and sharing settings. See Projects for more information.
Related topics
- Projects — create and manage projects
- Layers — add and organize map layers
- Features — add and edit features on the map
- Running an analysis — execute and view analysis results